Now that you’re familiar with navigating and modifying workspaces and charts, let’s get into how to change time frames, change currency pairs and other symbols, how to change price style to view Japanese Candlesticks, Lines or Histograms and more.
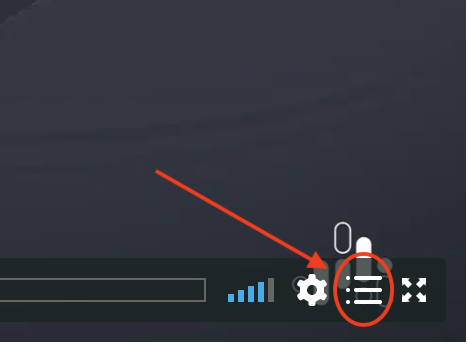 | Open the navigation menu here to view the chapters in this video |
Chapters in This Video
- Symbol selection
- Changing the time frame
- Changing the Price Style (line chart, candlestick chart, bar chart, etc)
- Chart overlay (compare and add symbol)
- Zooming on the chart
- Undo and redo
- Cursor type